
The Indian mutual fund industry has undergone an unprecedented expansion in its investor base during the post-2020 market boom. So far, it has held on well. The gains it has made seem foundational in nature, and its intrinsic appeal has withstood the tapering of returns.
Deposits to funds
In the last five years, mutual funds’ assets under management (AUM) have swollen from ₹31 trillion in December 2020 to ₹80.23 trillion in December 2025—a compounded annual rise of a solid 21%. At this rate, effectively, they double in three-and-a-half years. However, not all of this increase is attributable to individual investors, given that even institutions and companies invest in mutual funds.
Having said that, mutual fund investments now make up a greater share of the financial assets of Indian households. According to India’s central bank, as of March 2020, mutual funds had a 7% share in the financial assets of Indian households. In March 2024, this figure crossed 10% for the first time, and has inched up further in March 2025, according to the latest available data. During this period, the share of bank deposits—which are typically about low post-tax returns, along with low risk—in financial assets of Indian households has dropped from 46.2% to 43.4%.
Disciplined investing
Systematic investment plans (SIPs) are a big reason for these gains, not only from a past perspective, but also from a future perspective. SIPs are automatic investment plans offered by mutual funds, wherein a specified amount is deducted from an investor’s bank account on a particular date each month and invested in a scheme of their choice. Such automatic scheduling ensures discipline in making investments. In equity funds, it also does away with the investor dilemma of trying to time the market.
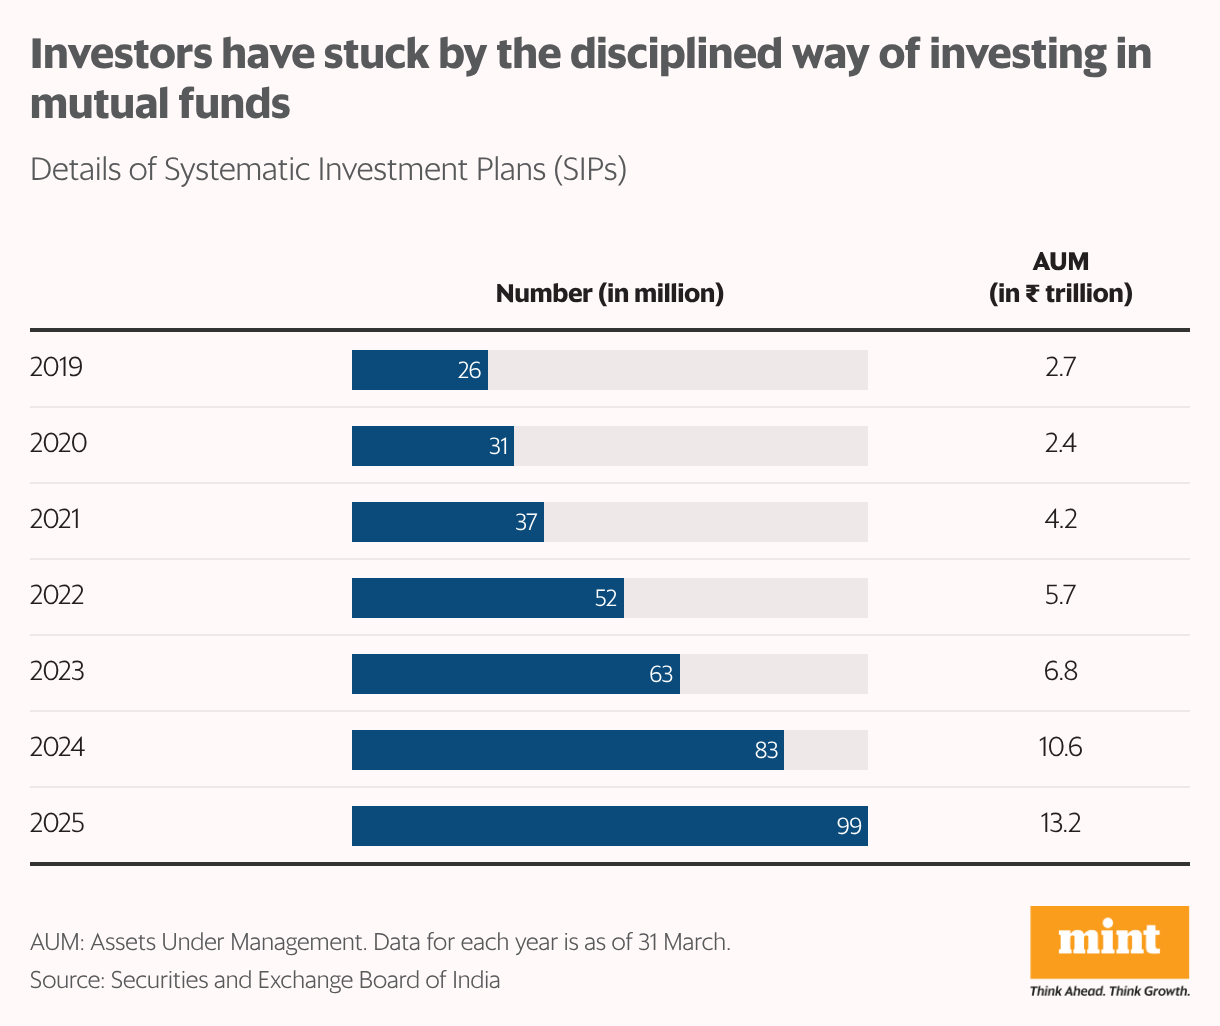
Between March 2020 and March 2025, the number of active SIP accounts has risen about three times, from about 31 million to about 99 million. At the same time, the amount invested via SIPs has jumped 5.5 times, from ₹2.4 trillion to ₹13.2 trillion, implying investors are making higher allocations. While net additions to SIPs (SIPs started minus SIPs closed) have dropped in recent months, it is still a positive figure.
Beyond the metros
A high quantum of SIPs augurs well for the mutual fund industry in the long run. Given the way they are structured, SIPs tend to be more sticky. From a long-term perspective, what also bodes well for the mutual funds industry is that the new accounts are increasingly coming from beyond the top cities, which is indicative of new markets opening up. For example, in terms of the number of SIP accounts, the share of the next 30 cities after the top 30 cities has increased from 47% as of March 2020 to 55% as of March 2025.
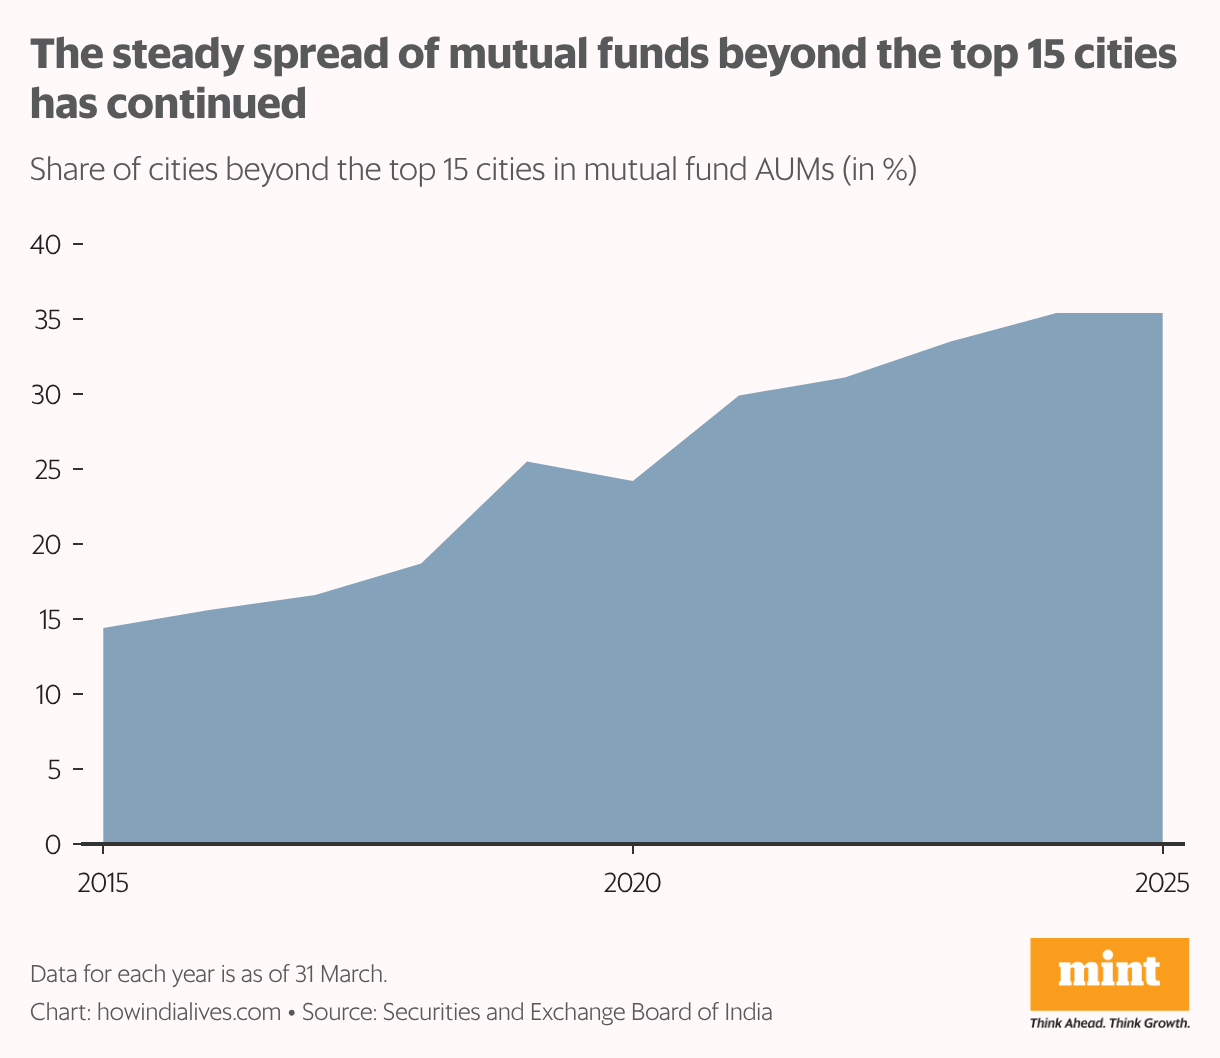
New investors, or more money from existing investors, are coming into mutual funds from beyond the top cities at an ever-increasing pace. According to the capital markets regulator Securities and Exchange Board of India (Sebi), the share of cities beyond the top 15 in mutual fund AUM has increased from 14.4% in March 2015 to 35.4% in March 2025. This is also a consistent increase, with an uptick in share seen in nine of the last 10 years.
Long-term thinking
What the mutual fund industry seeks is more investments coming in and staying. It helps them on the money management side, as they have to make fewer forced adjustments to their portfolios to manage outflows. Stickiness also helps them grow the business. Even for investors, the risk-return profile of mutual funds means they work best in the long term.
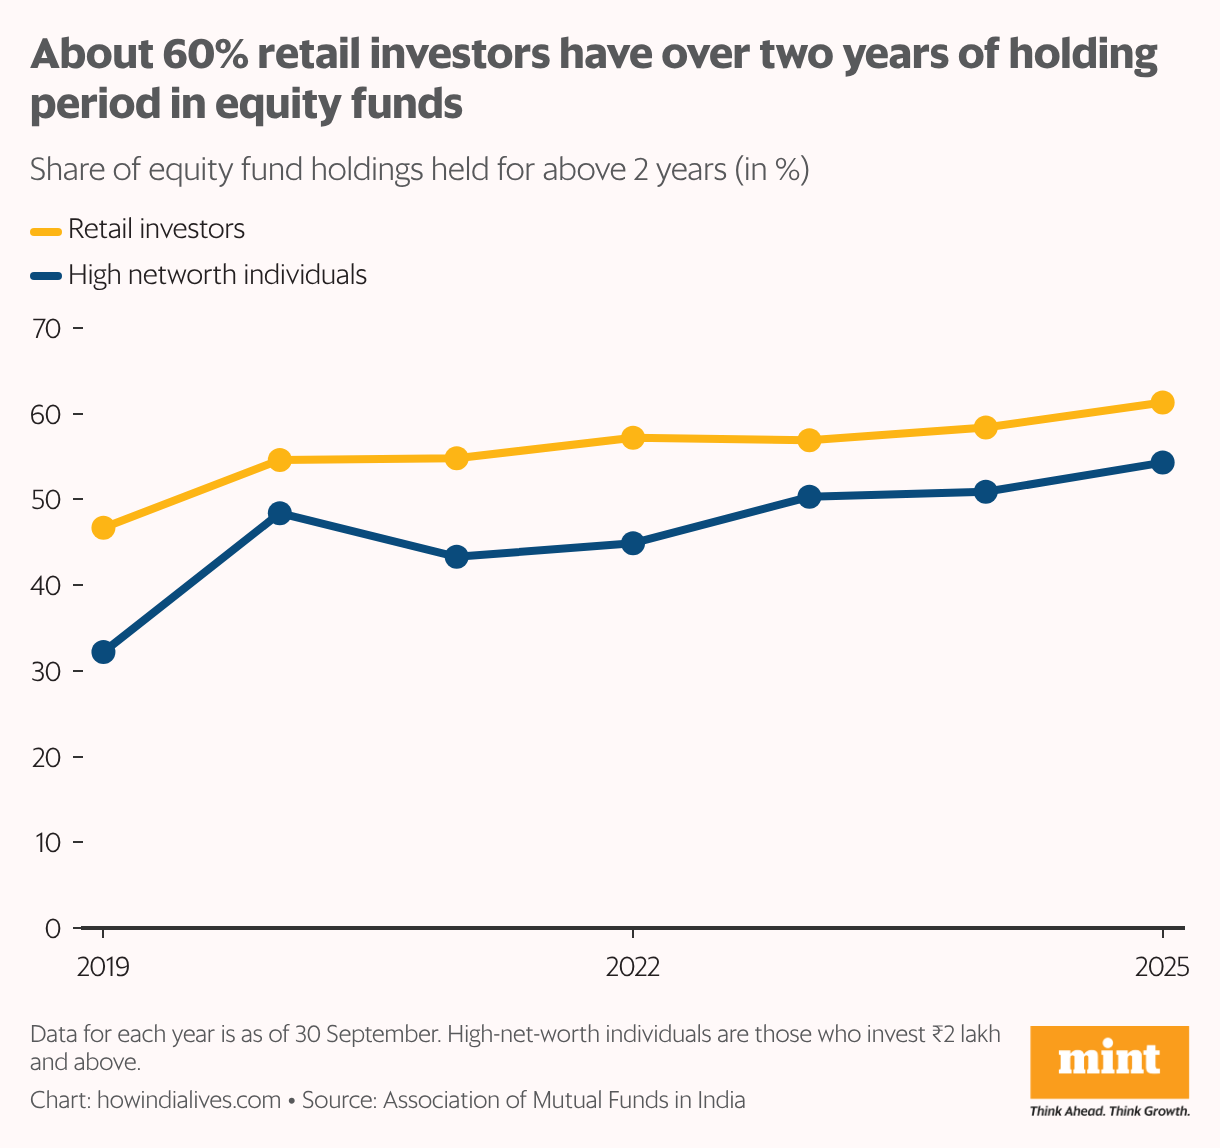
This is especially true of equity funds, which invest in shares of companies and are thus exposed to market volatility. If companies grow in size and profitability, their share prices should rise—and so should mutual fund returns. But for this cycle to play out can take several years, even a decade. Data from the Association of Mutual Funds in India (Amfi) shows that individual investors are getting better at staying the course. As of September 2019, 47% of their investments in equity funds had a holding period of above two years. As of September 2025, this figure had increased to 61%.
Bypassing commissions
Besides staying invested longer, investors are also increasing their returns by investing more directly, either through mutual funds themselves or via platforms. This results in lower expenses and potentially higher returns, because no commissions are paid to distributors. The other option is to invest via banks and distributors in ‘regular plans’, which entail commissions.
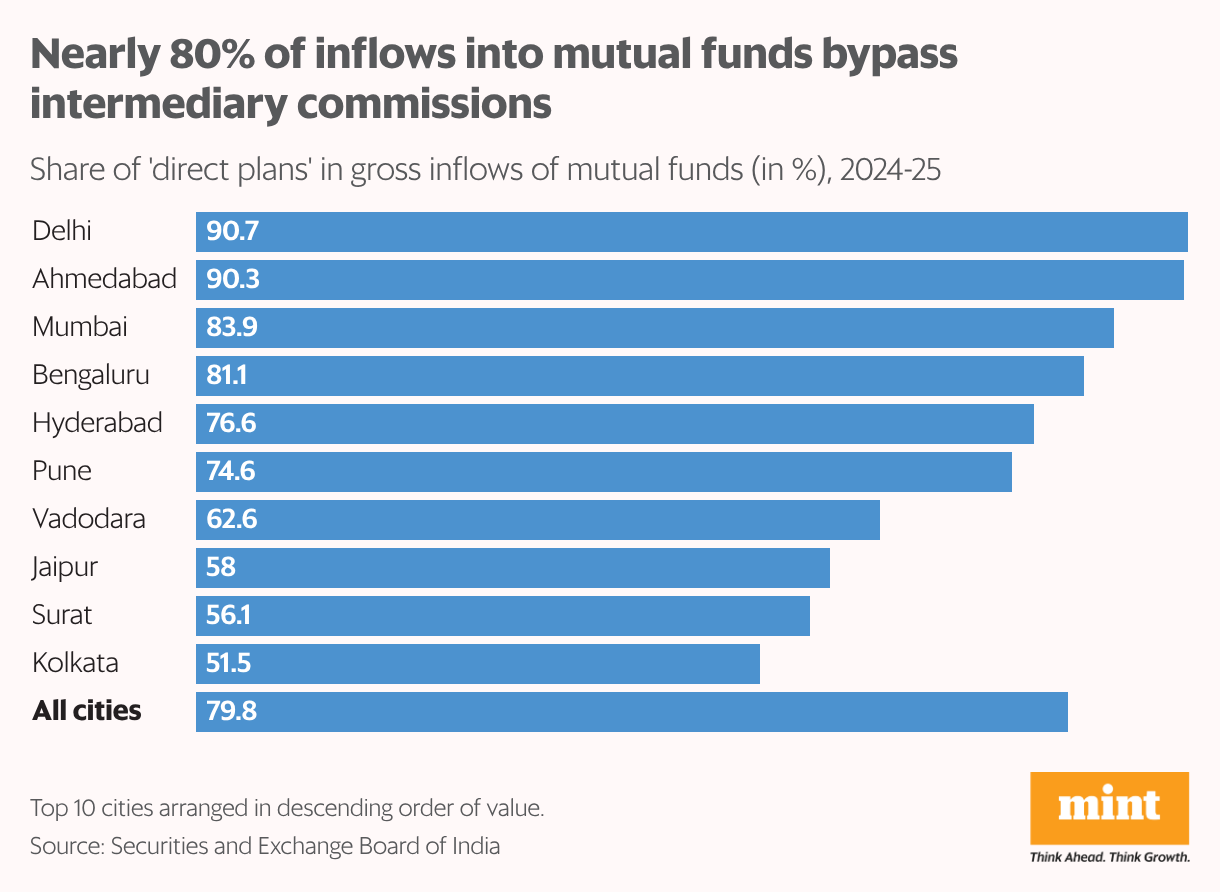
The difference in returns can be significant. For example, over a five-year period, Nippon India Large Cap Fund yielded a compounded annual return of 19.43% in its direct plan and 18.42% in its regular plan. On a ₹1 lakh investment, that is a difference of about ₹10,000. In 2024-25, about 80% of investments in mutual funds were in ‘direct plans’. Across cities, there was a variance, with this figure being higher in metros like Delhi, Ahmedabad, and Mumbai. But in smaller cities like Chennai and Chandigarh, it was below 50%. Regardless, the growth of the last few years should hold the industry in good stead, even if the market turns challenging.
www.howindialives.com is a database and search engine for public data.
